Aerocon River Studio
A web GIS dashboard built for irrigation and river engineers — live satellite imagery, automatic river bank digitisation, 1–15 year erosion and trend analysis, RTK-calibrated levels, flow-perpendicular cross-sections, cut/fill volumes, contours and a client-ready report, all from one dashboard.
- Automatic river bank & centreline digitisation
- Multi-year erosion/accretion & bank-migration analysis
- RTK/DGPS-calibrated DEM, cross-sections & cut/fill
- AutoCAD DXF, Excel BoQ & editable PPT/PDF reports
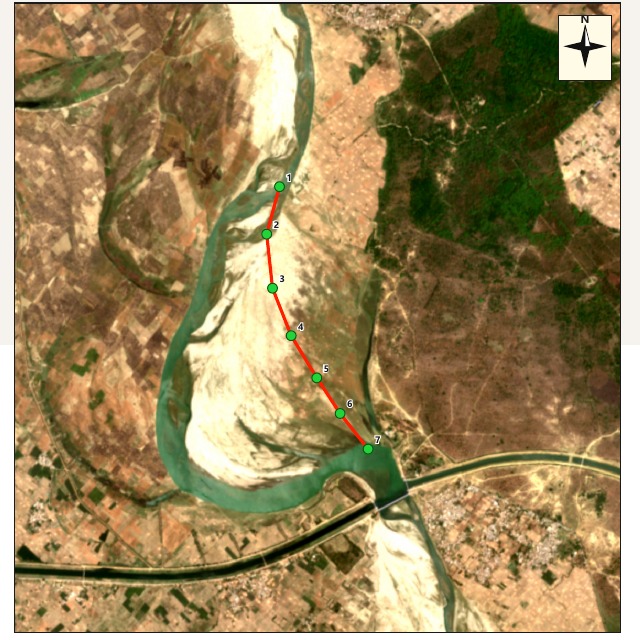
Sample capability study: screenshots on this page are drawn from a demonstration river-training report generated by Aerocon River Studio for a stretch of the Rapti river upstream of a barrage — produced end-to-end from satellite imagery to client-ready drawings.
From Satellite Image to Client Report
One dashboard, eight stages — everything an irrigation department or river-engineering team needs for a DPR-grade study.
Project & AOI
Draw or upload the area of interest (up to 2,500 sq km). Projection is set automatically from the AOI's UTM zone.
Satellite Imagery
Search Sentinel-2 / Landsat by date and cloud cover, or auto-pick the clearest scene — ranked by cloud measured inside the AOI itself.
River Digitisation
Automatic water-body extraction (MNDWI + edge detection, K-means or Random Forest), producing a water polygon, centreline and both banks.
1–15 Year Trend Analysis
Per-year bank lines on one reference centreline give chainage-wise migration rates, erosion/accretion polygons and year-on-year area change.
Levels & RTK Calibration
Base DEM calibrated against your RTK/DGPS control points, merged with imported survey CSV or DSM — survey data always takes priority over satellite elevation.
Sections & Cut/Fill
Cross-sections at any interval, normal to the true flow direction, with exact cut/fill volumes by average end-area and prismoidal methods.
Contours & CAD Export
Minor/major contours with spot levels, exported as AutoCAD DXF, GeoJSON and CSV — ready to drop into existing design workflows.
Client Report Studio
A full true-scale client deliverable — cover, key plan, multi-year imagery, schematic plan, bathymetry, L-section, cross-sections and BoQ — as PDF or editable PowerPoint.
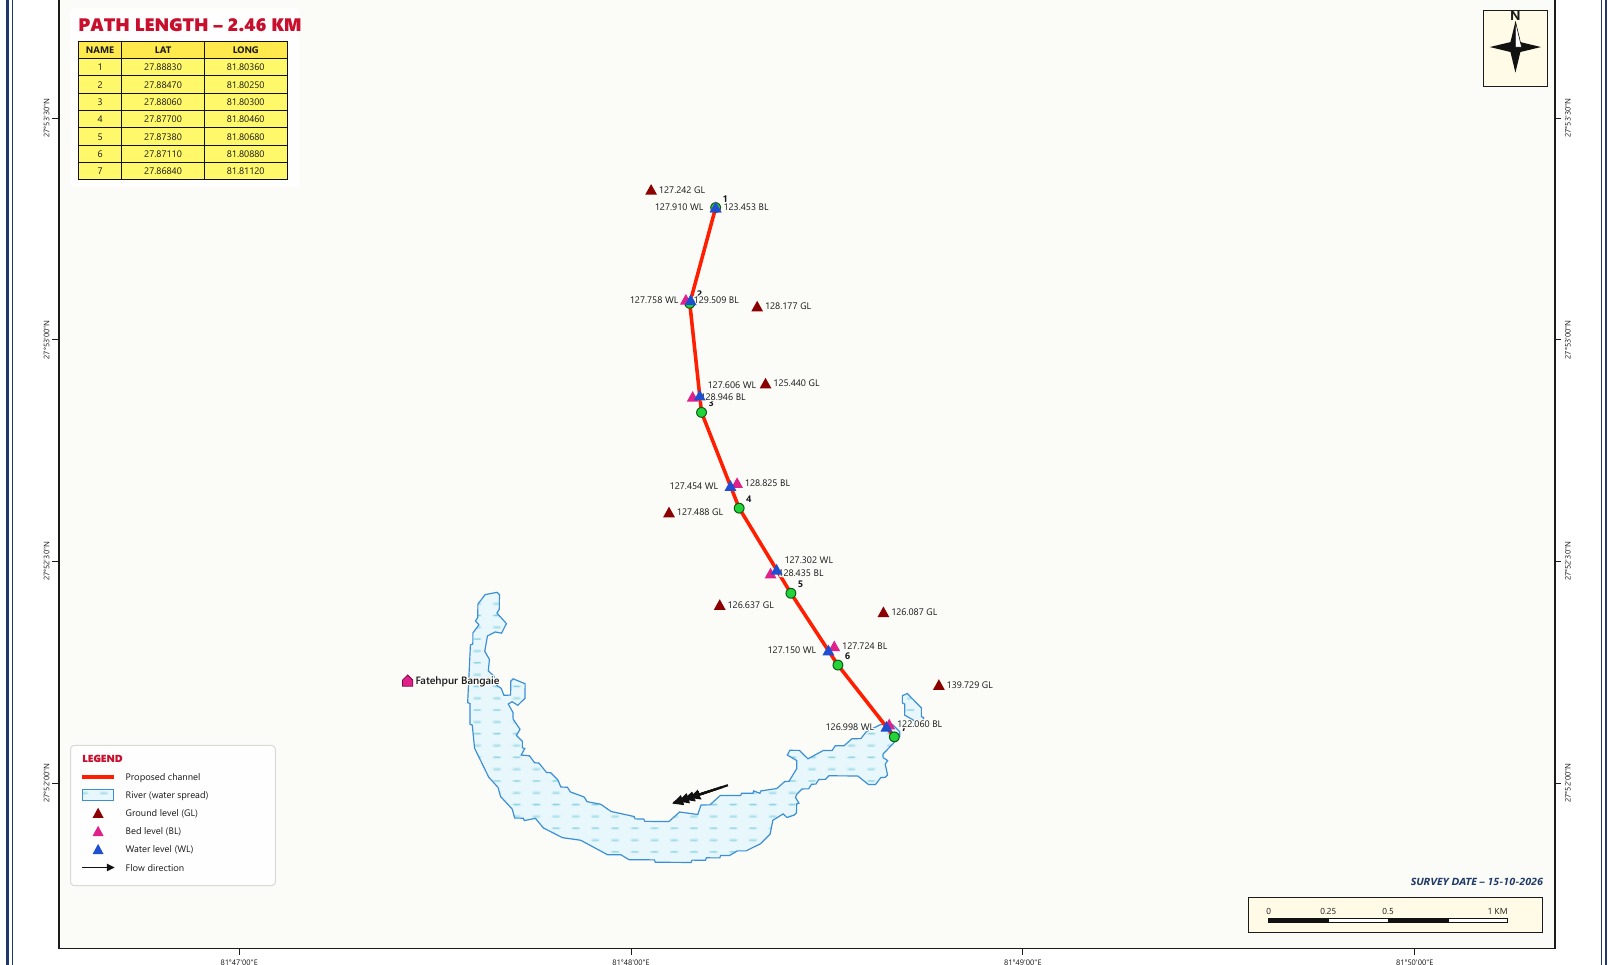
Every Point, Georeferenced
Ground level, bed level and water level are plotted at every survey point along the proposed channel — with exact latitude/longitude, flow direction and a scale bar, ready to drop straight into a DPR.
- Auto-generated schematic plan with GL / BL / WL legend
- Flow-direction arrows derived from the DEM, not guessed
- Village and landmark labels pulled into the drawing

Depth Mapped Below Water Level
Survey soundings are rendered as a colour-graded depth map directly over the satellite base — so dredging zones are visible at a glance, not buried in a spreadsheet.
- Colour-graded 0–8 m depth scale, fully customisable
- Feeds directly into cut/fill and dredging-volume calculations
- Overlays cleanly on any year's satellite imagery
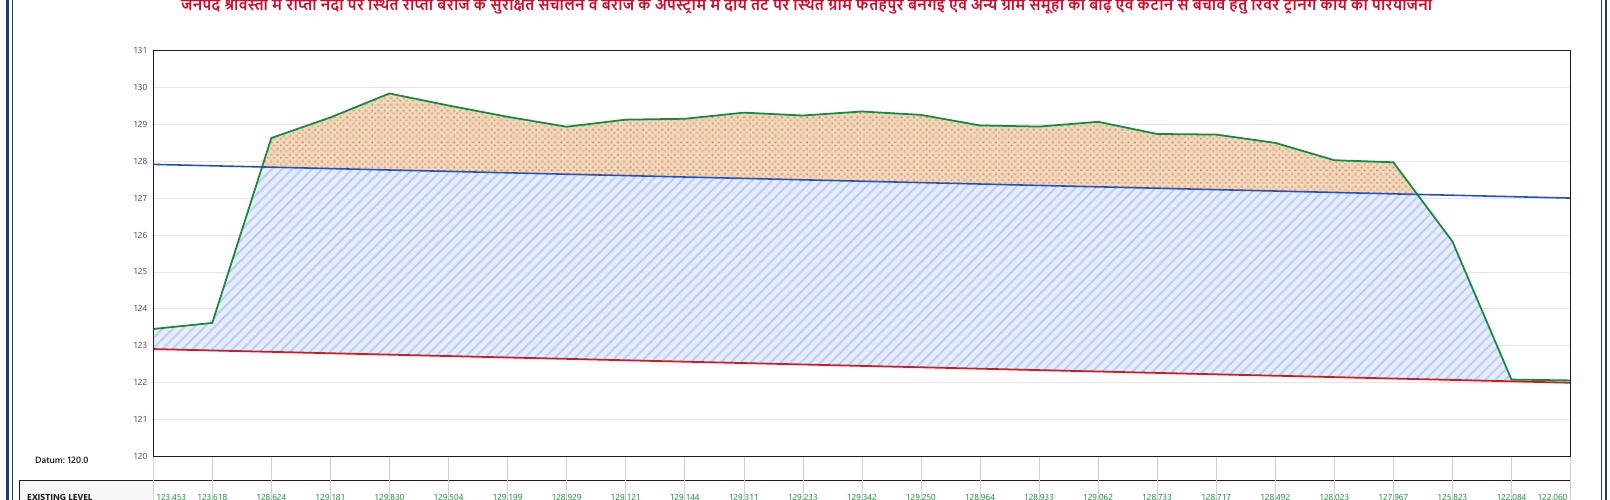
Existing Ground, Water & Proposed Levels
Chainage-wise levels, excavation and dredging depths, computed automatically from the calibrated DEM and your design parameters.
Deliverables You Can Hand Over
PDF Engineering Report
Cover, key plan, trend tables, change analysis, DEM & calibration summary, L-section, BoQ, section sheets and contours.
Excel BoQ with Live Formulas
A real .xlsx with genuine Excel formulas (not flattened numbers) for length, volume, and cumulative cut/fill — editable by your own team.
Editable PowerPoint Deck
The full Client Report Studio deliverable rebuilt as an editable widescreen deck, with a real quantity table at the end.
AutoCAD DXF & GeoJSON
Contours, centrelines, bank lines and cross-sections export directly into AutoCAD and standard GIS formats.
Bring Your Next River Study to Aerocon River Studio
Talk to us about river training works, bathymetric surveys, erosion studies or DPR-grade reporting for your department or project.
Get in Touch